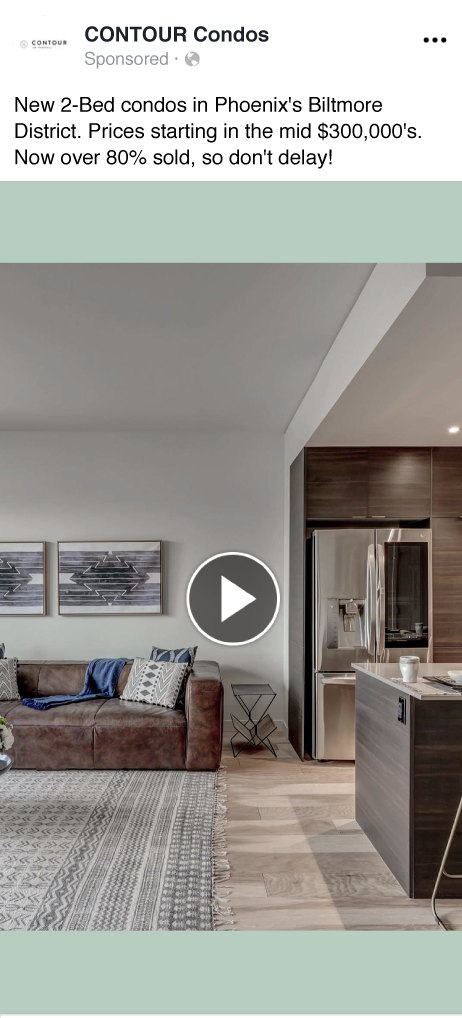
CONTOUR CONDOS.

GTMA applied a long history in creative visual production and social marketing strategy to the sale of LivURBN’s exclusive CONTOUR on Campbell condominiums in Phoenix’s upscale Biltmore District. This limited collection of residences offer luxury living in 1-3 bedroom options beginning at $350,000.
CONTOUR ON CAMPBELL.
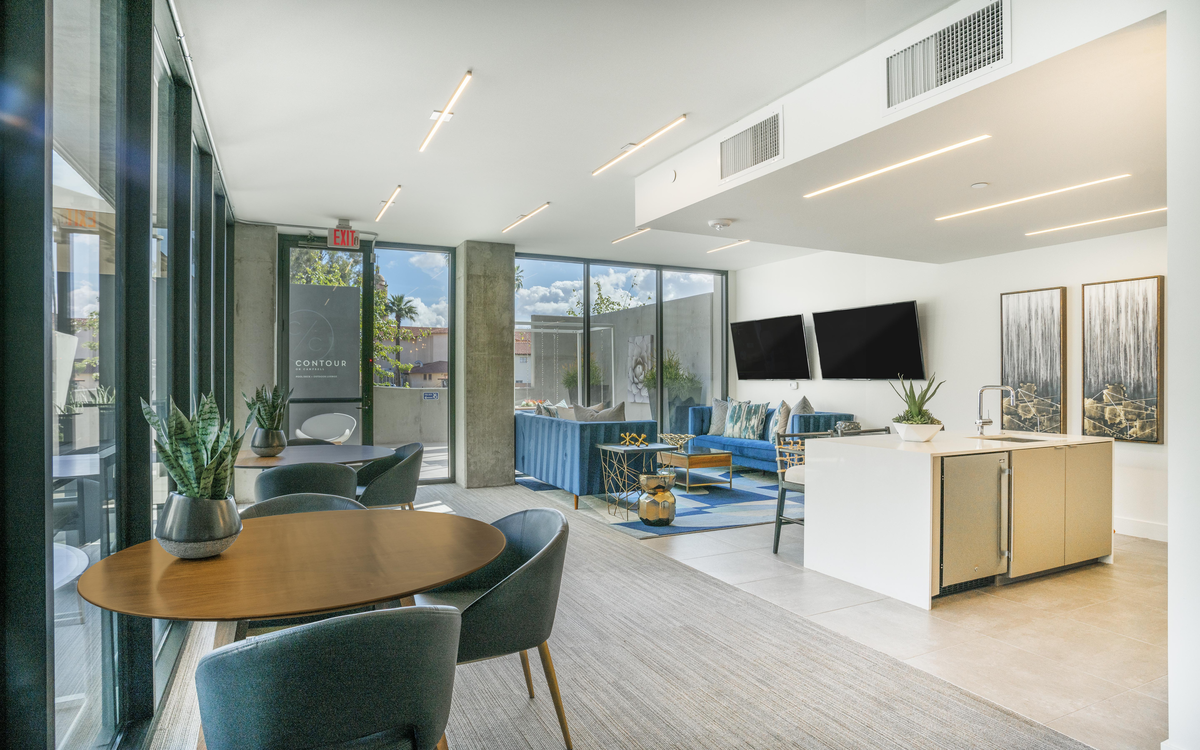
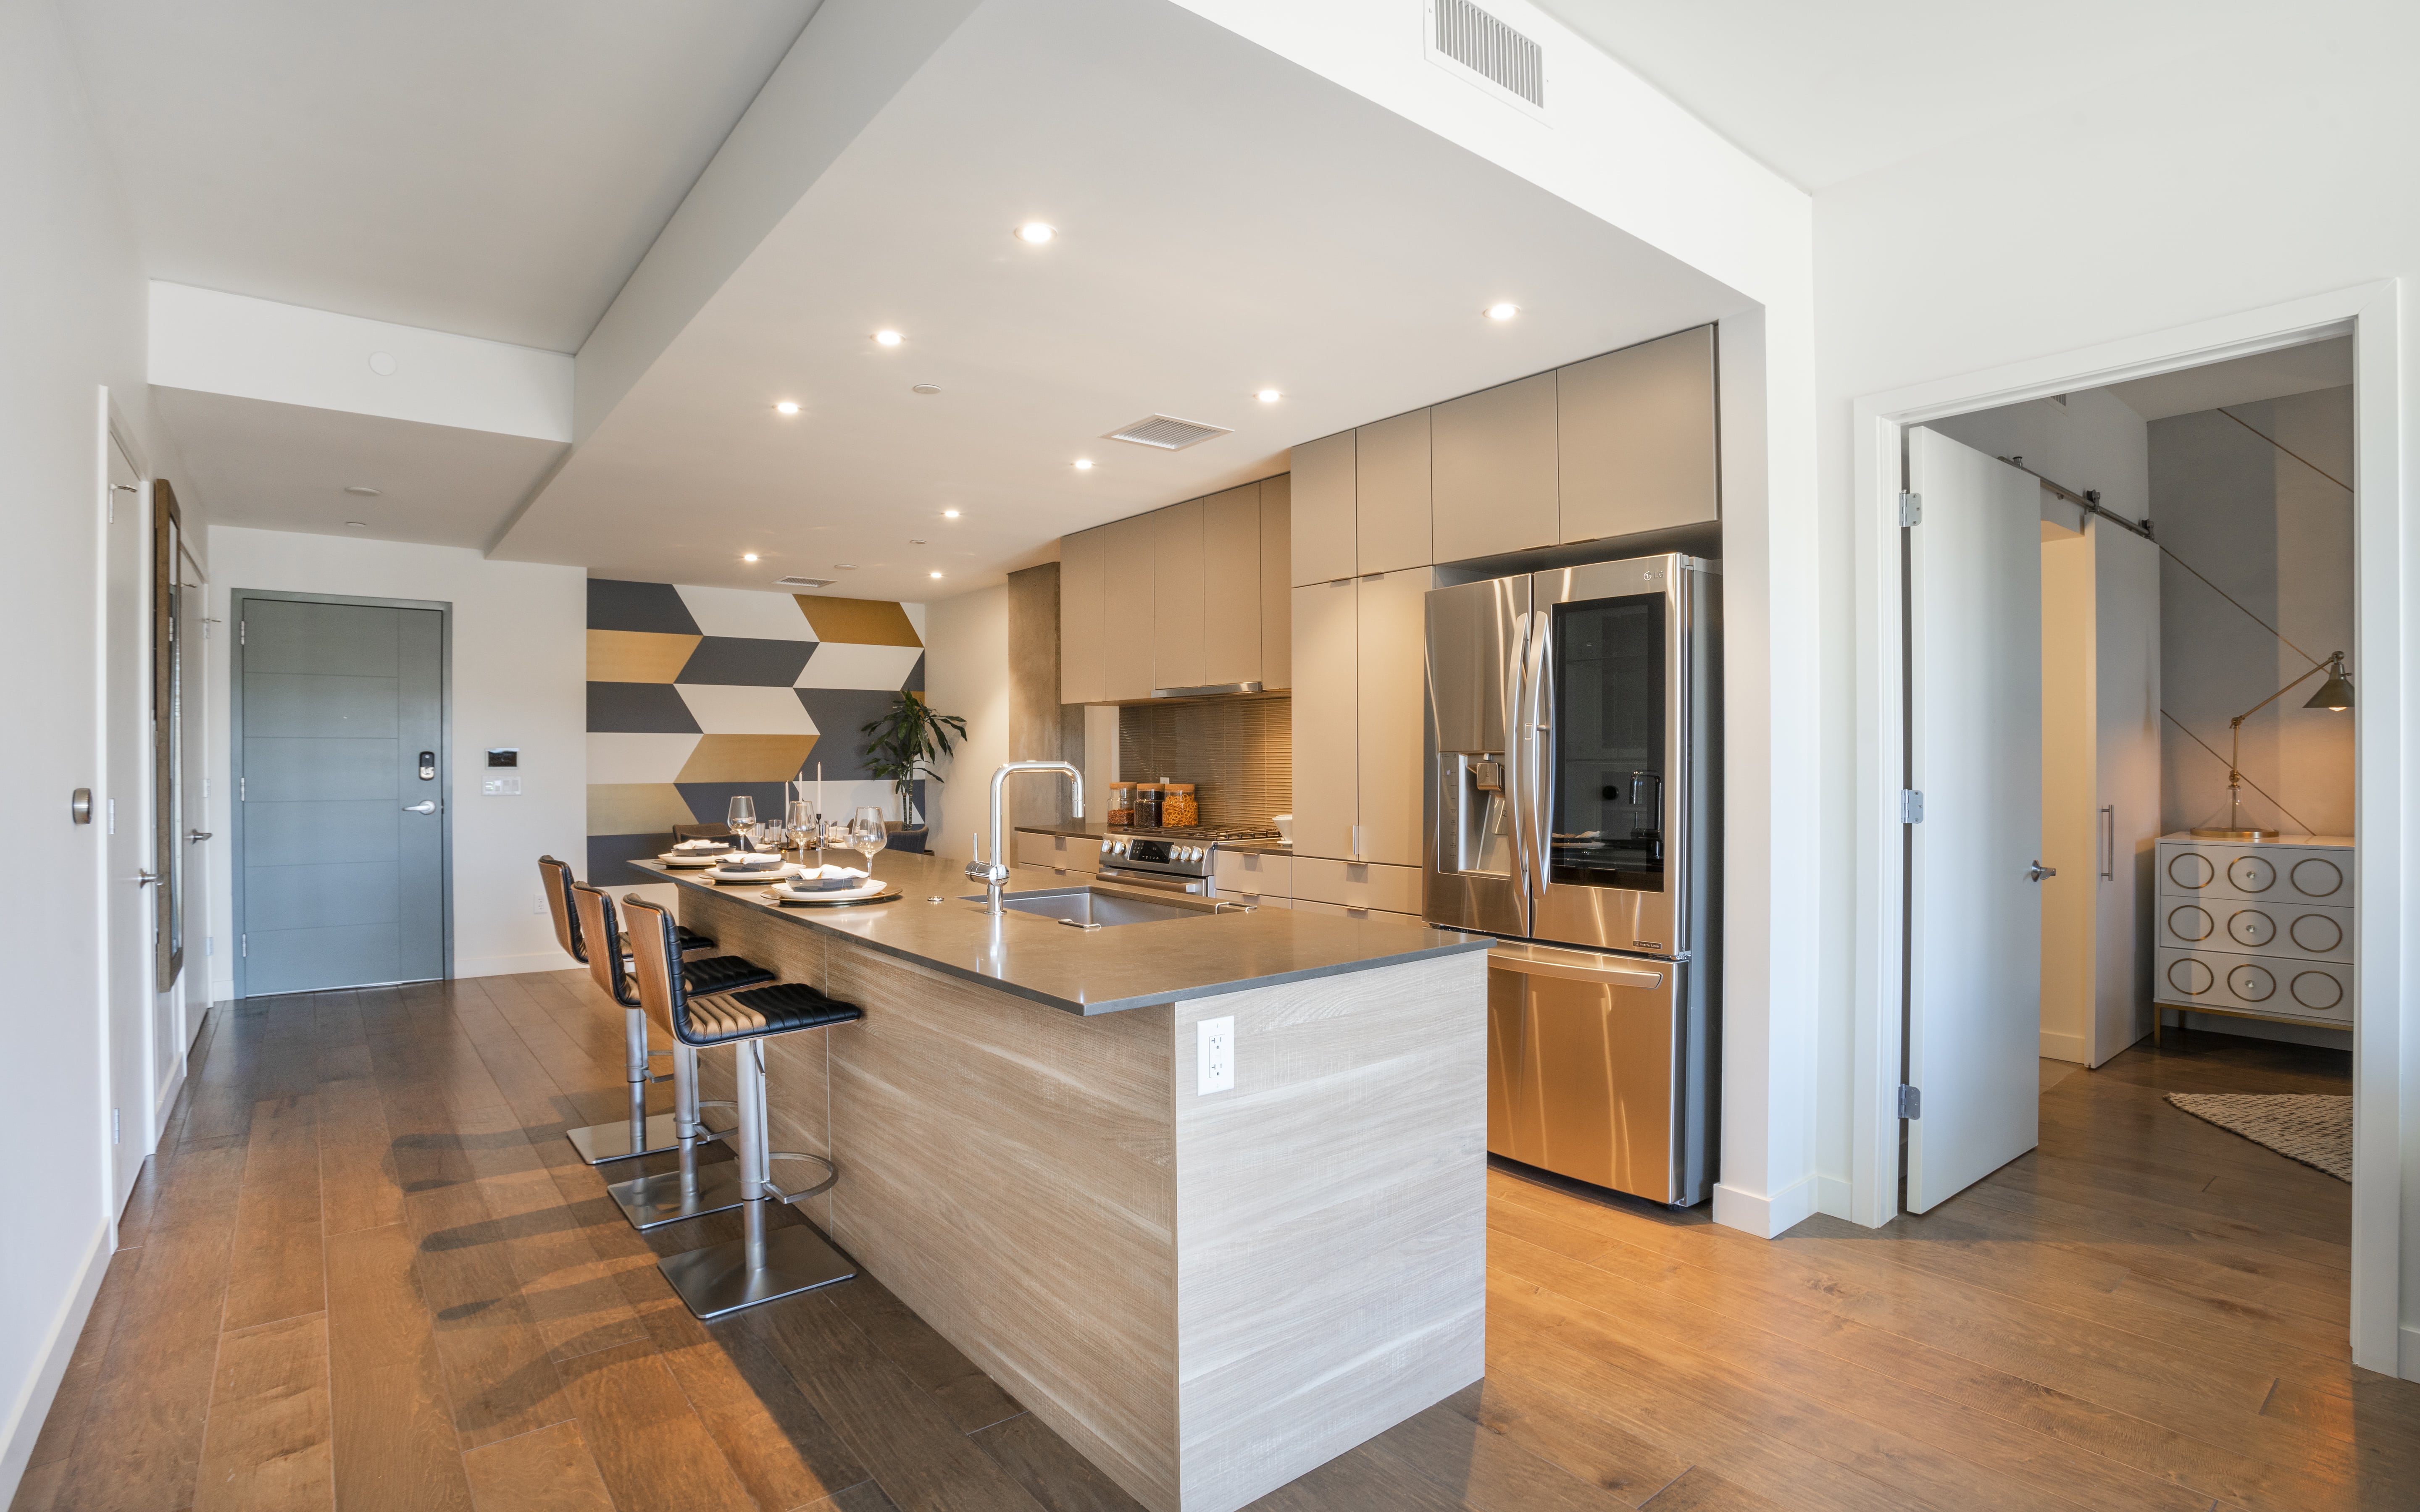
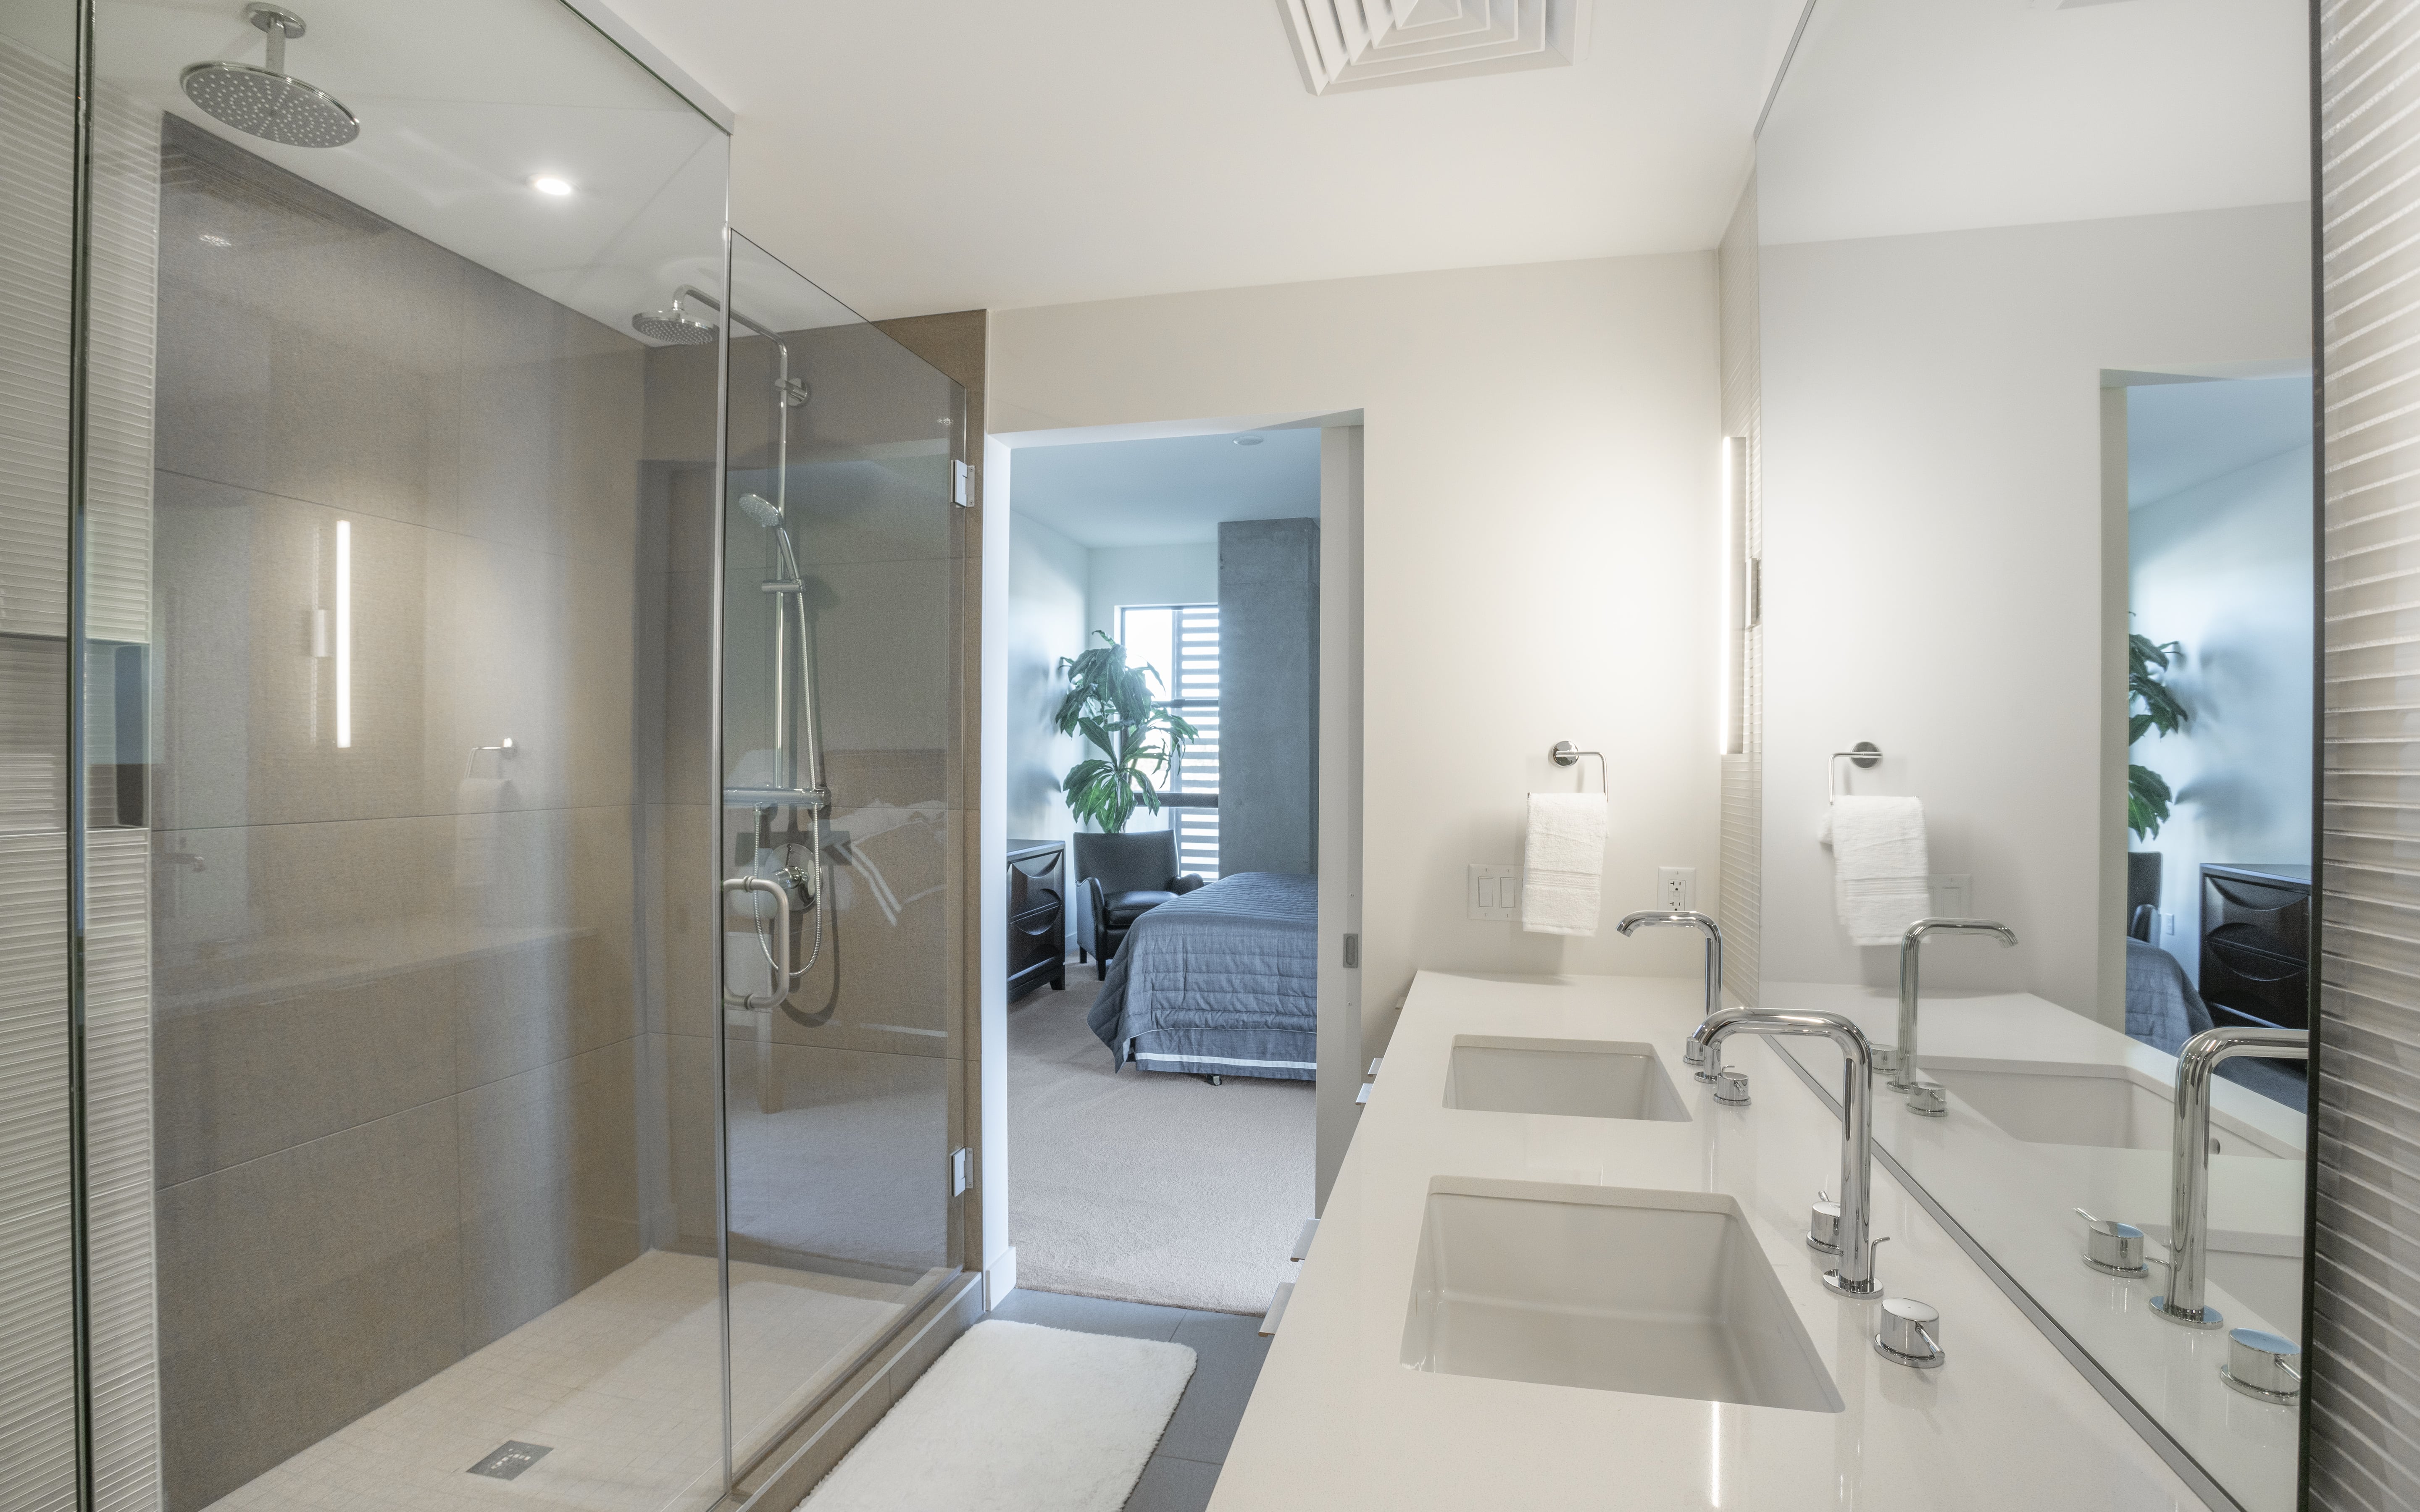
CONTOUR's collection of contemporary homes feature expansive indoor and outdoor living experiences with culinary-inspired appliances, beautiful wood floors, lavish bathroom suites, and large private garden terraces offering up to ~702 square feet of outdoor living space.
SERVICES PERFORMED FOR THIS CLIENT.
PHOTOGRAPHY.
SOCIAL ADVERTISING.
SOCIAL MEDIA MANAGEMENT.
VIDEO PRODUCTION.
LEAD GENERATION.


display ads.


SOCIAL ADVERTISING.
From January to April 2019, CONTOUR received direct sales and numerous online leads from our social marketing campaign.
7 DIRECT SALES.
50 FACEBOOK LEADS.
16 INSTAGRAM LEADS.


CLIENT COMMENTS.
HAVE THEIR BEEN ANY NOTICEABLE CHANGES IN THE FREQUENCY OF SALES WHEN GTMA BEGAN WORKING ON THE CONTOUR CAMPAIGN?
Does the onsite sales team have any feedback on the quantity and/or quality of leads since the start of the campaign?
“
They say that the leads that are coming through Facebook are very well qualified. Sometimes sales gallery visitors expect pricing to be lower. We are okay with this as we want to get the prospect in the sales gallery so that the sales team can talk with them and give their pitch. Also important that our ads are self-qualifying and including pricing.
What can GTMA improve on in either the onboarding process, reporting, and/or the management of the campaign?
“
The meeting during the kick-off every week was very helpful to get the campaign running.
Next time I’d recommend we include the sales team in the discussion so that they can describe what they are seeing with the buyers/on the sales floor.

“
From January 2019 – May 2019 we had 452 new prospects. This is much higher than the 5 months before this (327 prospects).